
Reports and wall screen
The numbers you need to make decisions.
See how many people get in touch, when they do, and how many get an answer. You choose what you want to see.
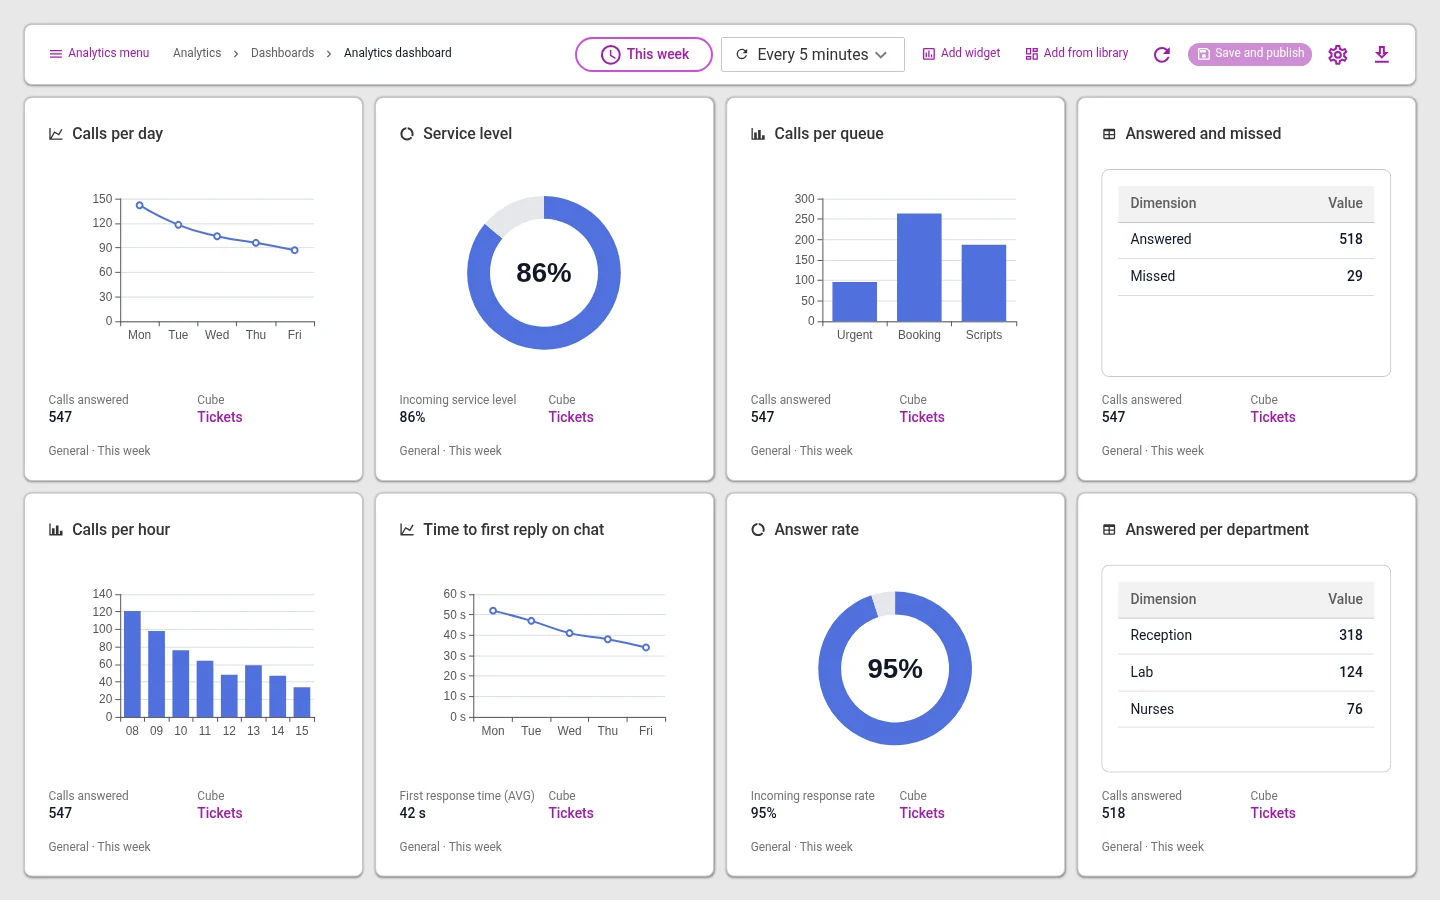
Make your own overview
Choose the charts you want to see, and move them where you want them. Save the overview, and it is ready next time.
- Lines, bars, tables and big numbers
- Choose a day, week, month or your own dates
- See one channel, one queue or everything together
When do people call?
Calls per hour and per day
How many are answered in time?
How many got an answer, and how many got it within the time you have set
How long do they have to wait?
Waiting time, and time to first reply on email and chat
Why do they get in touch?
Cases by reason
How much does AI handle?
Cases AI answered, and cases passed on to a colleague
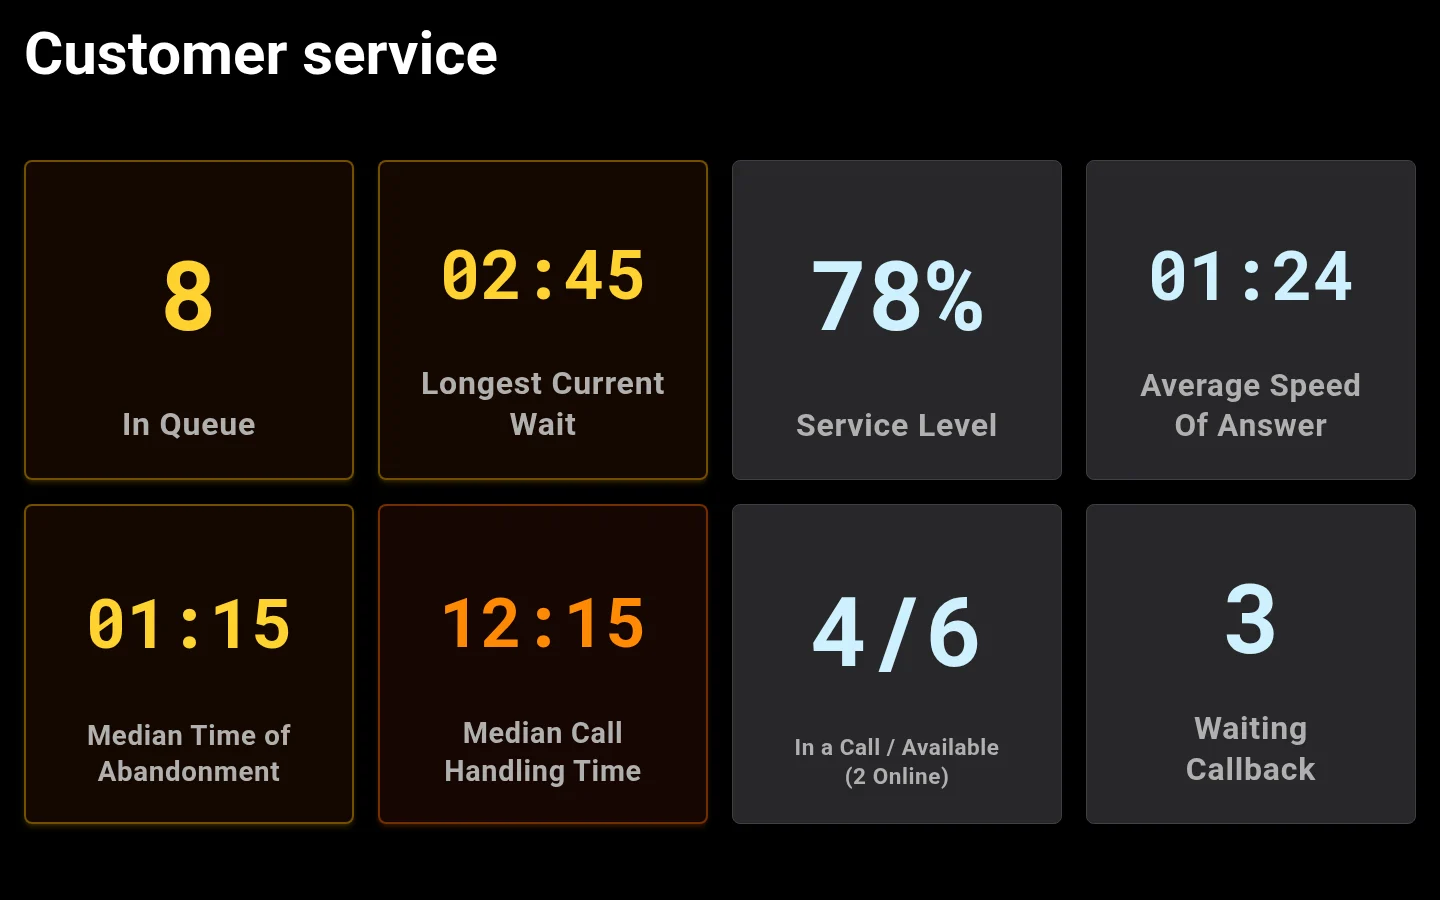
Show the queue on a screen
Put up a screen on the wall. Everyone sees the same thing: how many are waiting, for how long, and who is free.
- The number turns yellow or red when it passes the limit you have set
- Good for contact centres with many people answering
“Omnicus has a fantastic system to offer.”
Heidi Birkeland, contact centre manager at Limbra, on contact centres and statistics.
Quotes translated from Norwegian.
Can we see the numbers for one queue?
Yes. Choose the queue, channel and time period for each chart.
Can we export the call list?
Yes. An administrator can download the call history as a file for Excel.
Who sees the reports?
The people who have been given access. Read about roles and access.
See it set up the way you work
In the demo we show the channels you need, with the queues and opening hours you have today. We also answer questions about price and getting started.